Network Performance
Network reliability overview
Reliability of supply is a key measure of the performance of the electrical network. System Average
Interruption Duration Index (SAIDI) is the measure of the number of minutes on average that Endeavour Energy’s customers are without electricity each year due to unplanned events. The following two metrics of SAIDI are used to understand reliability performance of the network:
- normalised SAIDI which excludes incidents which occur on major event days, and incidents that are eligible for exclusion under the AER guidelines, and
- un-normalised SAIDI which does not exclude any incidents and is representative of the customer felt experience.
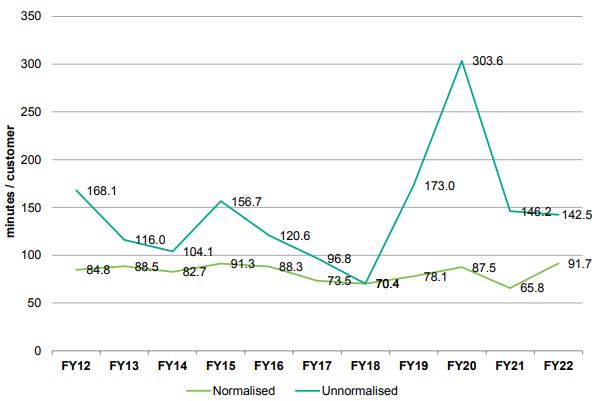
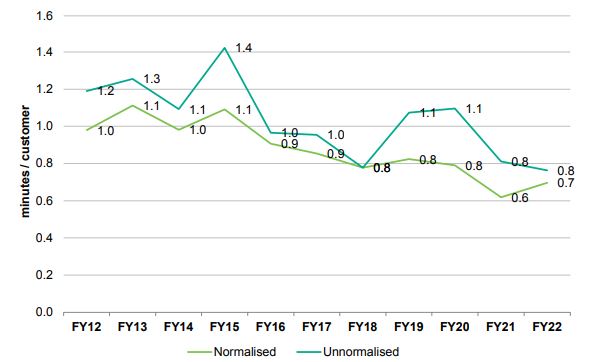
Major Event Days are typically associated with adverse weather conditions and are excludable when reporting normalised reliability results. Below graphs shows the total SAIDI and SAIFI trend (includes major event day reliability) as well as normalised SAIDI and SAIFI.
Organisational SAIDI Trend (Total and AER Normalised)
Organisational SAIFI Trend (Total and AER Normalised)
Endeavour Energy’s AER normalised and unnormalised SAIFI performance exhibits a stable and improving trend in recent years. However, recent unnormalised SAIDI has seen a deterioration in performance from FY19 to FY22 over previous years due to an increase in the frequency of major climate events.
Trends in reliability target performance
The NSW Minister for Energy first imposed licence conditions for the distribution network service providers on 1 August 2005 covering design planning standards, reliability, individual feeder and customer service standards. The conditions were designed to give guidance to the distributors regarding the performance levels expected by the NSW Government.
The current licence conditions were imposed on 7 July 2017, with a minister’s variation in February 2019. Table 3 provides the reliability performance information required by licence conditions 7.3 including:
- performance against the SAIDI average standards and SAIFI average standards by feeder type, disregarding excluded interruptions, and
- reasons for any non-compliance by the licence holder with the reliability standards and plans to improve performance.
The data listed in below table is the ‘normalised’ data set i.e. the overall data with ‘excluded’ interruptions deducted. ‘Excluded’ interruptions are defined in Schedule 4 of the licence conditions and are primarily outages of less than three-minute duration or outages caused by directed load shedding, planned maintenance, failure of the shared transmission system or ‘major event day’ outages.
FY22 Annual Network Reliability Performance
Whole network and feeder category | ||||||
Network* | CBD+ | Urban | Rural Short | Rural Long | ||
Customer numbers (Average over Year to Date) | 1,102,471 | N/A | 785,739 | 316,732 | 317 | |
SAIDI | Actual | 91.1 | N/A | 45.3 | 205.0 | N/A |
Standard from Licence Conditions | N/A | N/A | 80 | 300 | N/A | |
SAIFI | Actual | 0.695 | N/A | 0.447 | 1.312 | N/A |
Standard from Licence Conditions | N/A | N/A | 1.2 | 2.8 | N/A | |
* Refers to the average performance of the Endeavour Energy’s network overall. This measure does not form part of the licence conditions but is needed to calculate the overall NSW result.
+ The definition of a “CBD” area is a formal technical definition in the Reliability and Performance Standards against which Endeavour Energy is required to report. Key commerce centres at Parramatta, Liverpool, and Penrith which are supplied by Endeavour Energy do not fall into the official “CBD” category and hence there are no statistics against this category.
SAIDI is calculated from the sum of the duration of each sustained customer interruption (measured in minutes), divided by the total number of customers (averaged over the year) of the licence holder.
SAIFI is calculated from the total number of sustained customer interruptions divided by the total number of customers (averaged over the year) of the licence holder.
The Australian Energy Regulator (AER) introduced a Service Target Performance Incentive Scheme (STPIS) for NSW electricity distributors in 2014/15. This scheme encourages continuous improvement in reliability performance by offering financial incentives or penalties based on improvements or deterioration in performance from benchmark levels set in a prior period. From 2019/20 to 2023/24 Endeavour Energy’s reliability performance is measured against average performance achieved in the 2013 - 2018 period.
Endeavour Energy has a corporate objective of outperforming the expected target under the AER’s STPIS incentive scheme.
- Endeavour Energy invests in targeted reliability improvement works where justified to meet its licence conditions obligations.
- Endeavour Energy is leveraging new technology and modernising its network. In 2021, Endeavour Energy commissioned an Advanced Distribution Management System (ADMS) which has the capability to perform automated Fault location, Isolation and Service Restoration (FLISR). This system will leverage available remote operable switches on the distribution network to isolate and restore supply to customers following faults in a faster manner. FLISR is expected to be progressively enabled across the network commencing early 2023.
Service Target Performance Incentive Scheme
Management of reliability under a STPIS regime requires consideration of desired reliability outcomes as well as the interactions between expenditure and STPIS bonuses or penalties and the overall impact of these on customer prices. Therefore, Endeavour Energy’s approach is to focus on improvements to fault response efficiency, asset and defect management practices as well as to leverage modern technology solutions when assets are end of life and require replacement.
The SAIDI and SAIFI unplanned performance results (excluding major events) compared to the STPIS targets for Endeavour Energy are shown in the table below.
SAIDI and SAIFI STIPIS Targets vs 2021/22 Actuals
Category | SAIDI Actual | SAIDI Target | SAIFI Actual | SAIFI Target |
|---|---|---|---|---|
Urban | 45.3 | 60.1 | 0.447 | 0.716 |
Rural | 205.0 | 172.0 | 1.312 | 1.493 |
Quality of supply
Quality of supply refers to the performance of the network in terms of steady state voltage, sags and swells, voltage unbalance, harmonic distortion, and rapid voltage variation (or flicker).
The quality of supply performance of the network is impacted primarily by the characteristics of customer loads as well as by network events and by the configuration and operation of the network. In recent years steady state voltage has become the most pressing and challenging quality of supply parameter to manage due to the increased adoption of DER, particularly solar PV, which causes reverse power flows in many parts of the network.
Harmonic distortion and rapid voltage variation (or flicker) is managed through detailed assessments of significant customer load applications, particularly commercial/industrial loads and other high voltage customers are formally assessed and provided power quality allocations in accordance with the NER, relevant Australian Standards and ENA Guidelines.
Quality of supply standards
Endeavour Energy’s adopts limits for power quality parameters as per the planning levels in the AS/NZ61000 series of standards as referred to in the national electricity rules. Emissions allocations are provided to larger customers on a site-specific basis upon receipt of a connection application.
Quality of supply compliance
Steady state voltage
Endeavour Energy has increased its access to power quality data from customer smart meters significantly in the 2022 calendar year. This data is available from Meter Data Providers under commercial terms. Currently Endeavour Energy is accessing voltage data from some 50,000 customer meters across the network franchise area.
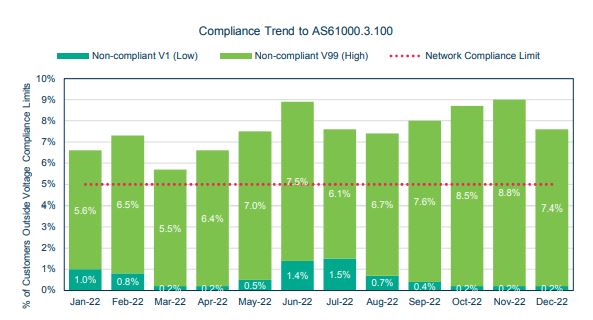
This smart meter data is being processed by an Analytics platform to automatically track and calculate compliance to the steady state voltage limits per AS61000.3.100. Under this standard, a network is determined to be compliant if less than 5% of customers are outside of the steady state voltage limits. Figure below shows Endeavour Energy’s compliance results per month across 2022.
Based on this sample of customer smart meter data it is evident that Endeavour Energy is non-compliant from a network overall level to the limits of AS61000.3.100. However the data has a bias to data from solar customers given this is the most common trigger for a smart meter to be installed. Therefore it is likely that the non-compliant high (V99) levels are biased and negatively impacting on the compliance assessment.
Nevertheless, there are several active programs to improve this compliance, including:
- Utilising LV Analytics to target proactive distribution transformer tap changing as well as adjustment of zone substation voltage settings to improve compliance.
- Commenced implementation of a Dynamic Voltage Management System (DVMS) at 116 of Endeavour’s 185 Zone Substations. This dynamically reduces the target voltage at the zone substation in the daytime to compensate for voltage rise from solar PV reverse power flows.
- Investing in new LV technology to improve poor performing LV networks. This includes the deployment of LV STATCOMs as well as trialling LV network support batteries.


